
Measuring impact
Four steps to quantify financial value at risk from sustainability
– in concrete monetary values
Published Feb 19, 2026·Updated Sep 22, 2026
Most companies roughly know their material sustainability risks and opportunities – but what they often don’t know is the price tag.
That’s now changing. Leadership teams, boards, and investors are increasingly demanding monetary values for sustainability topics to understand the ROI of sustainability activities. Also regulation increasingly calls for quantification of financial effects from sustainability.
At our February 2026 webinar, we asked hundreds of sustainability professionals: have you calculated concrete euro or dollar values for your sustainability risks and opportunities?
- 10% said yes — they have concrete figures
- 40% have qualitative estimates, but nothing monetised
- 40% plan to get there, but haven't started
- 10% consider it not relevant
The direction of travel is clear: sustainability teams are no longer questioning if they should quantify financial risks of sustainability topics, but how. Yet, only 10% of teams are currently able to produce robust figures.
Here’s Upright’s solution to fill that gap in four steps, demonstrated with data on L'Oréal.
A four-step process for putting numbers on sustainability risks
Here's the methodology Upright has developed over eight years of macro-modeling — simplified for practice.
Step 1: Gather the right inputsFinancial quantification starts with combining two types of data:
Company-specific data — financial statements, revenue breakdowns by product and service category, geographical information and sustainability indicators.
External data at scale — Upright's proprietary data engine draws on more than 300 million scientific articles and third-party databases, alongside value chain linkages between products and services.
The result is a rich, company-specific picture of what the business actually does, and where its sustainability exposures sit.
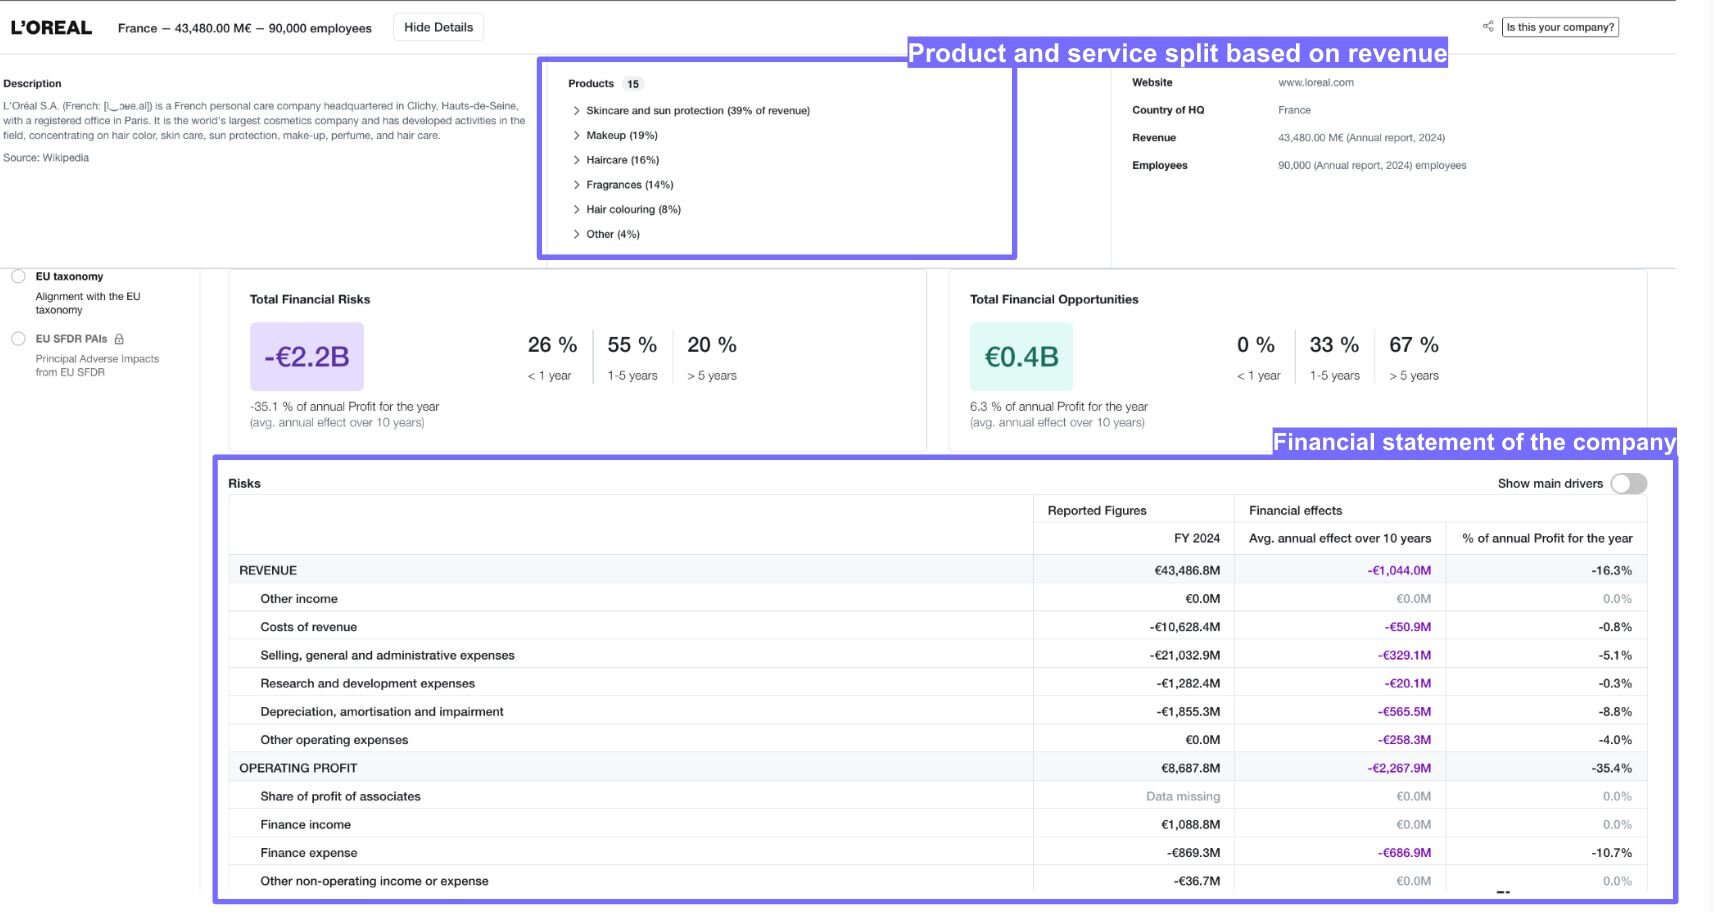
Upright Platform showing L'Oréal's revenue split and financial statements — note how product categories (skincare, makeup, haircare, fragrance) are weighted as inputs to the model
Step 2: Model the implicationsThis is where qualitative insight becomes quantitative output. The engine works in two passes:
First, it assesses the company's sustainability impacts across environmental, social, and governance dimensions — both positive and negative.
Second, it identifies which of those impacts create financial risks or opportunities, whether through the company's own activities or its dependencies on natural and social resources.
For each risk or opportunity identified, the model then quantifies:
- Probability — how likely is this to materialise?
- Magnitude — if it does, how large is the effect?
- Time horizon — is this a near-term or long-term exposure?
- Affected financial line items — does this hit revenue, cost of goods, CapEx, or something else?
Once those assumptions are grounded in scientific evidence, the model calculates the expected P&L, balance sheet, and cash flow effects — per risk, per opportunity, across every relevant line item.
Step 3: Analyse the outputsThe model doesn't just produce a single number. It gives you a layered view you can interrogate.
At the aggregate level, you see the total probability-weighted financial effect of all sustainability risks and opportunities on each line item. For L'Oréal, for example, the model calculates total financial risks of -€2.2B against total financial opportunities of €0.4B (averaged annually over a 10-year horizon).
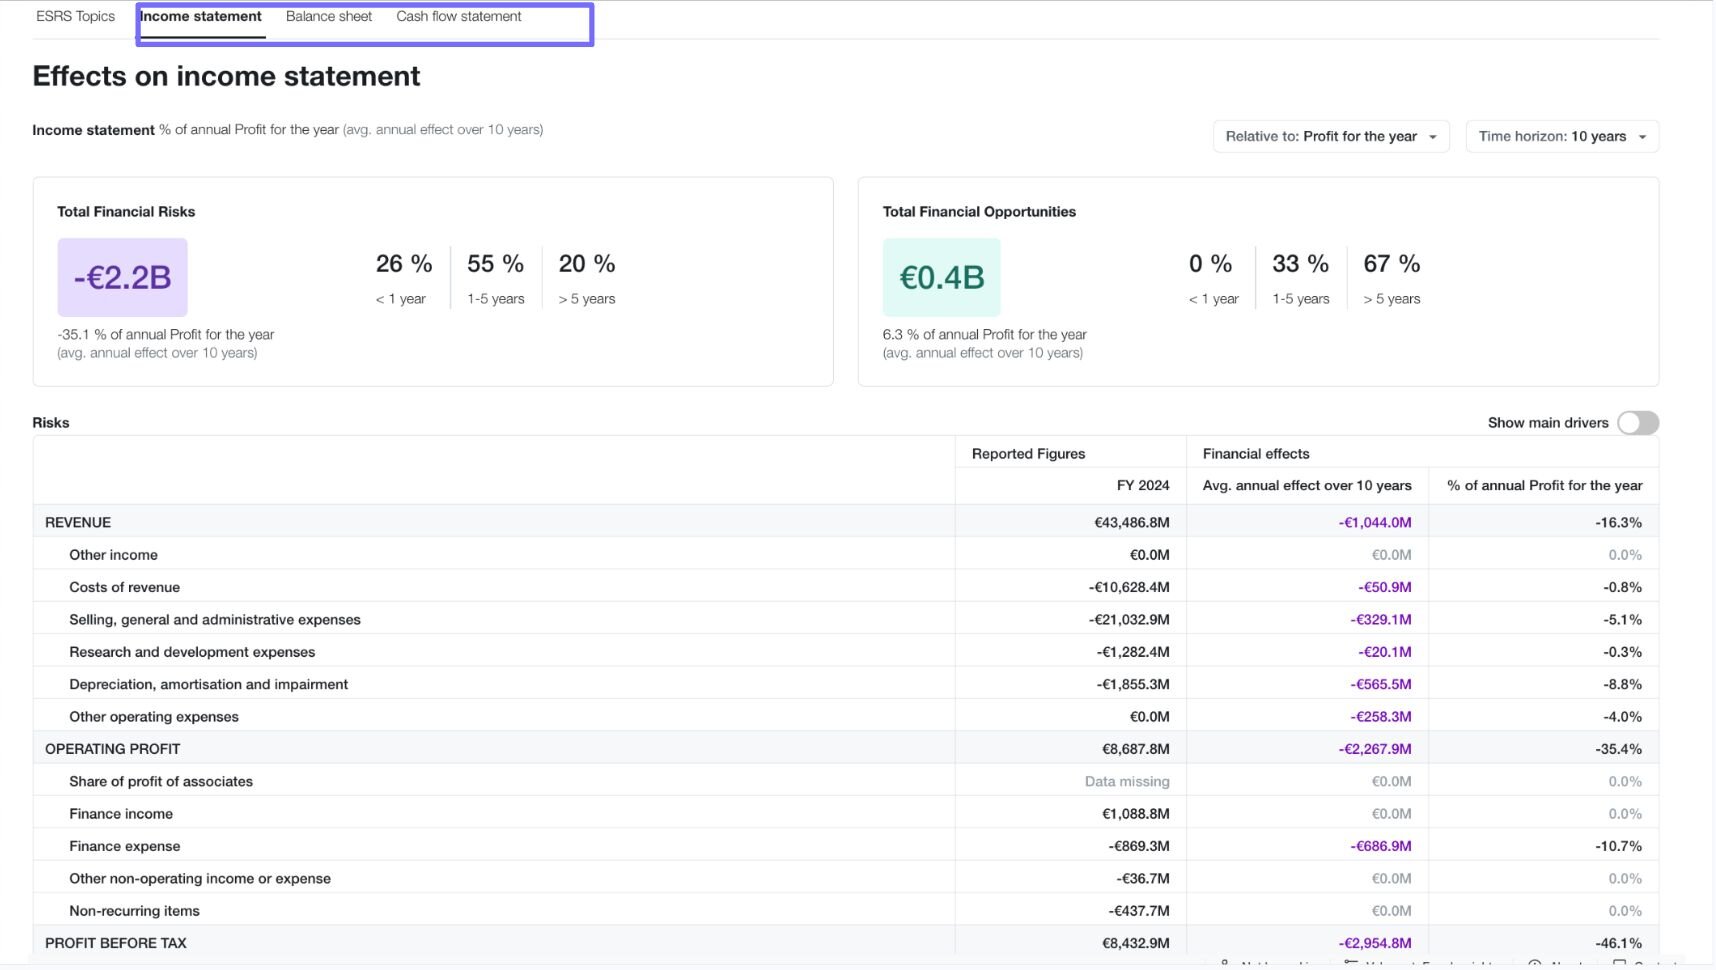
L'Oréal' income statement view showing financial effects per line item — operating profit, SG&A, depreciation, etc.
At the topic level, you can slice results by sustainability theme — climate change, pollution, biodiversity, own workforce, business conduct — and see which carry the greatest financial weight for this specific company.
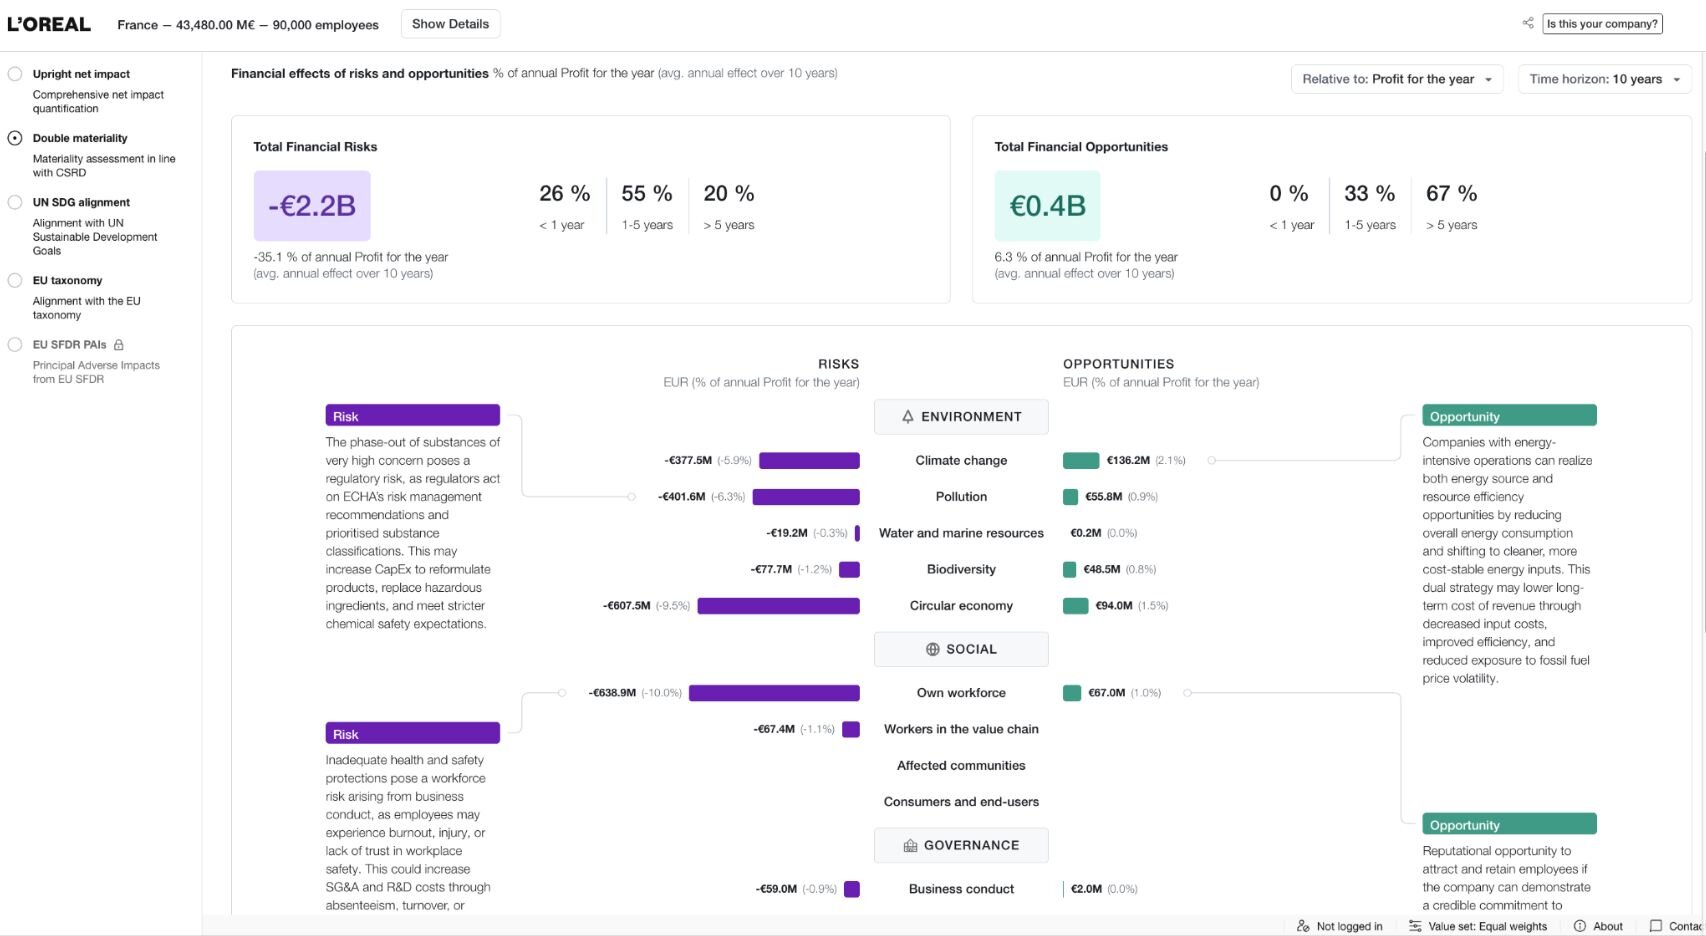
Topic-level breakdown showing risks and opportunities by ESG category, with climate and chemicals as the largest risk drivers for L'Oréal
Against benchmarks, you can compare the company's risk exposure to other companies to clarify where the company stands relative to its sector or peers.
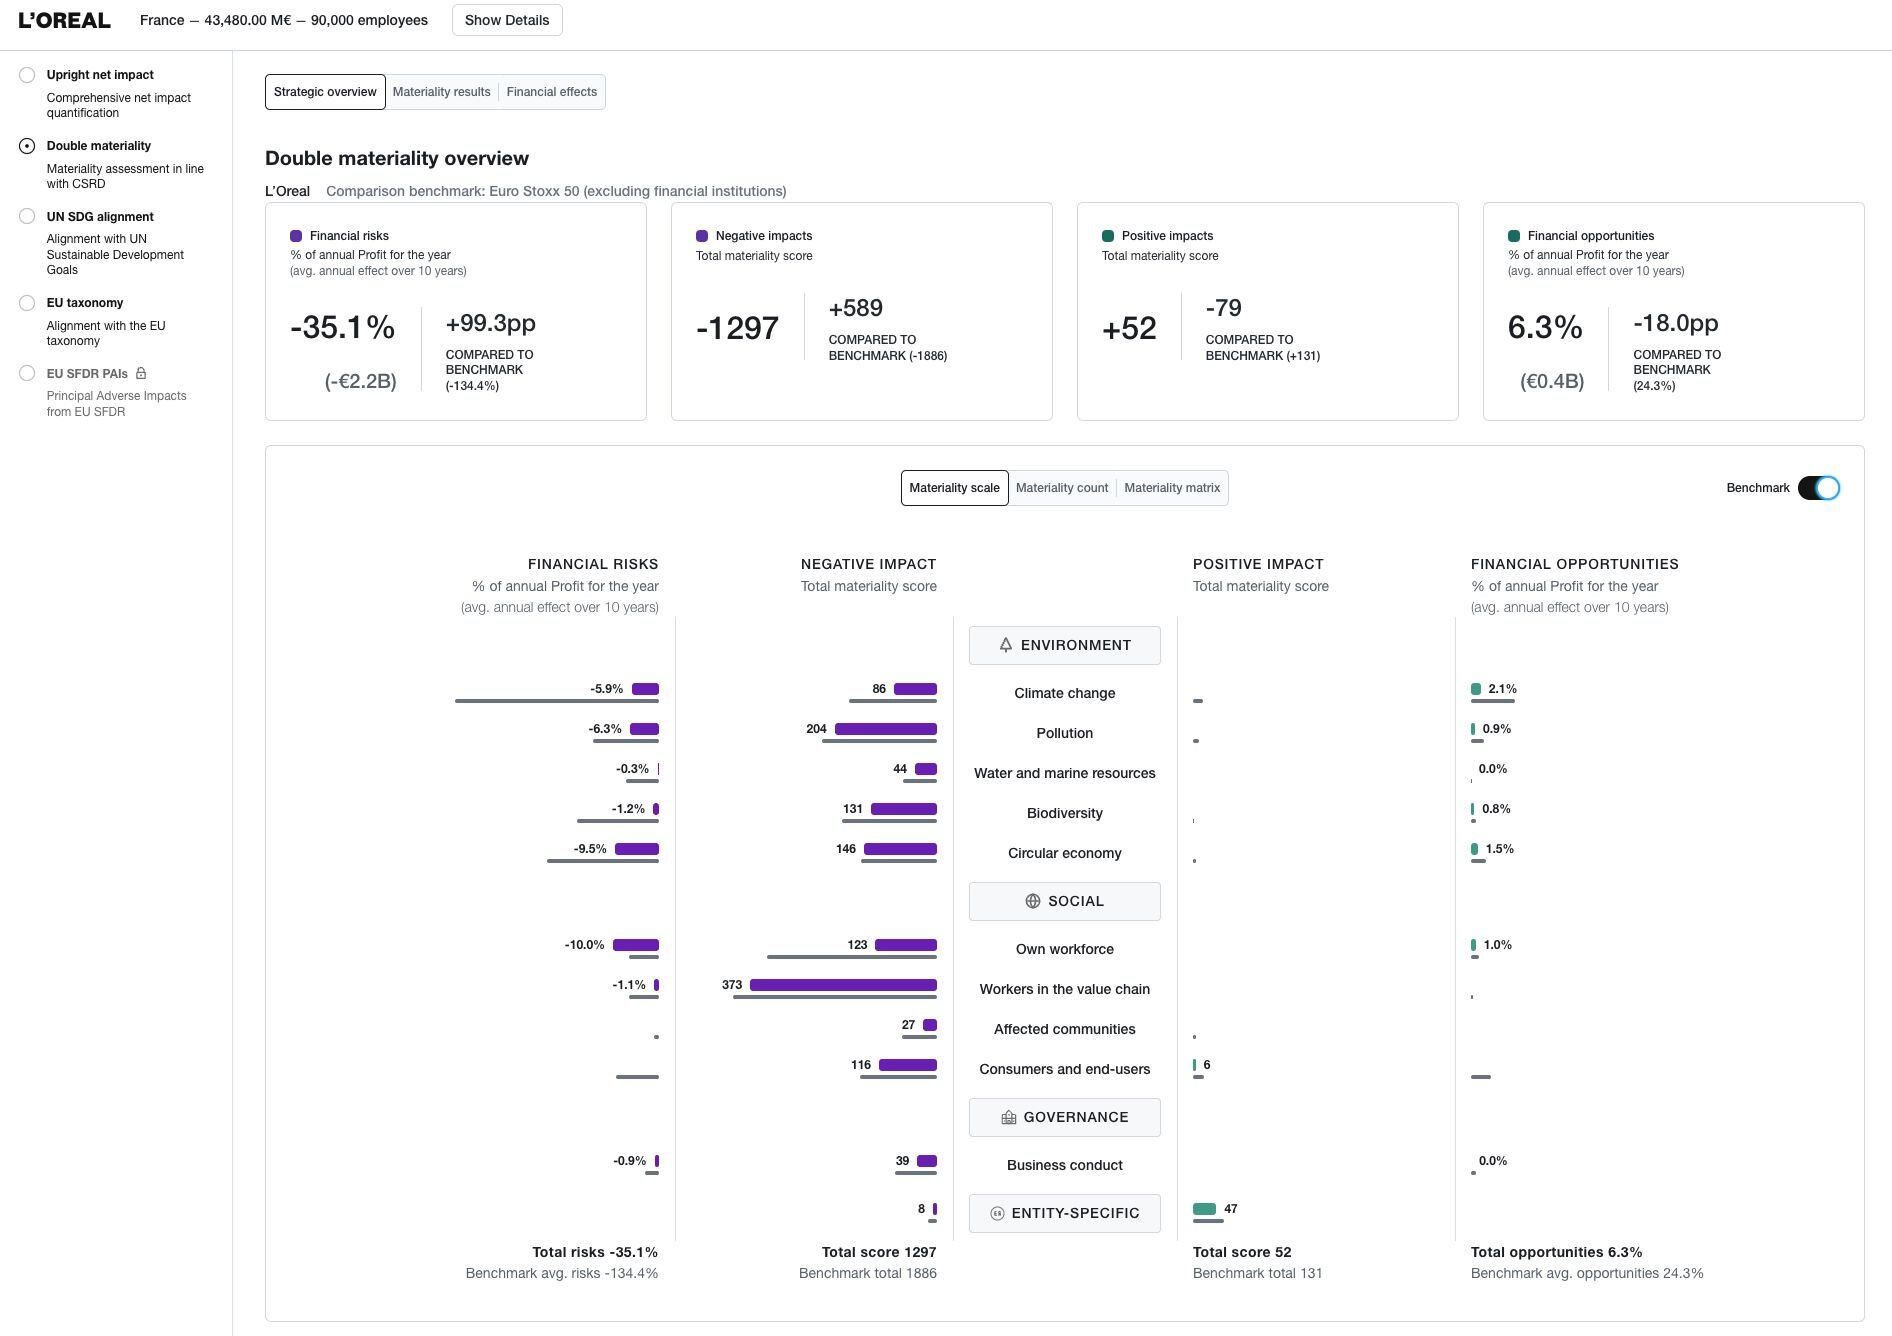
L'Oréal benchmarking view against Eurostoxx 50, showing relative positioning on financial risks and opportunities
At the individual risk level, you can drill into any single risk to see its driver, the specific financial line items it affects, its probability and magnitude, and its time horizon.
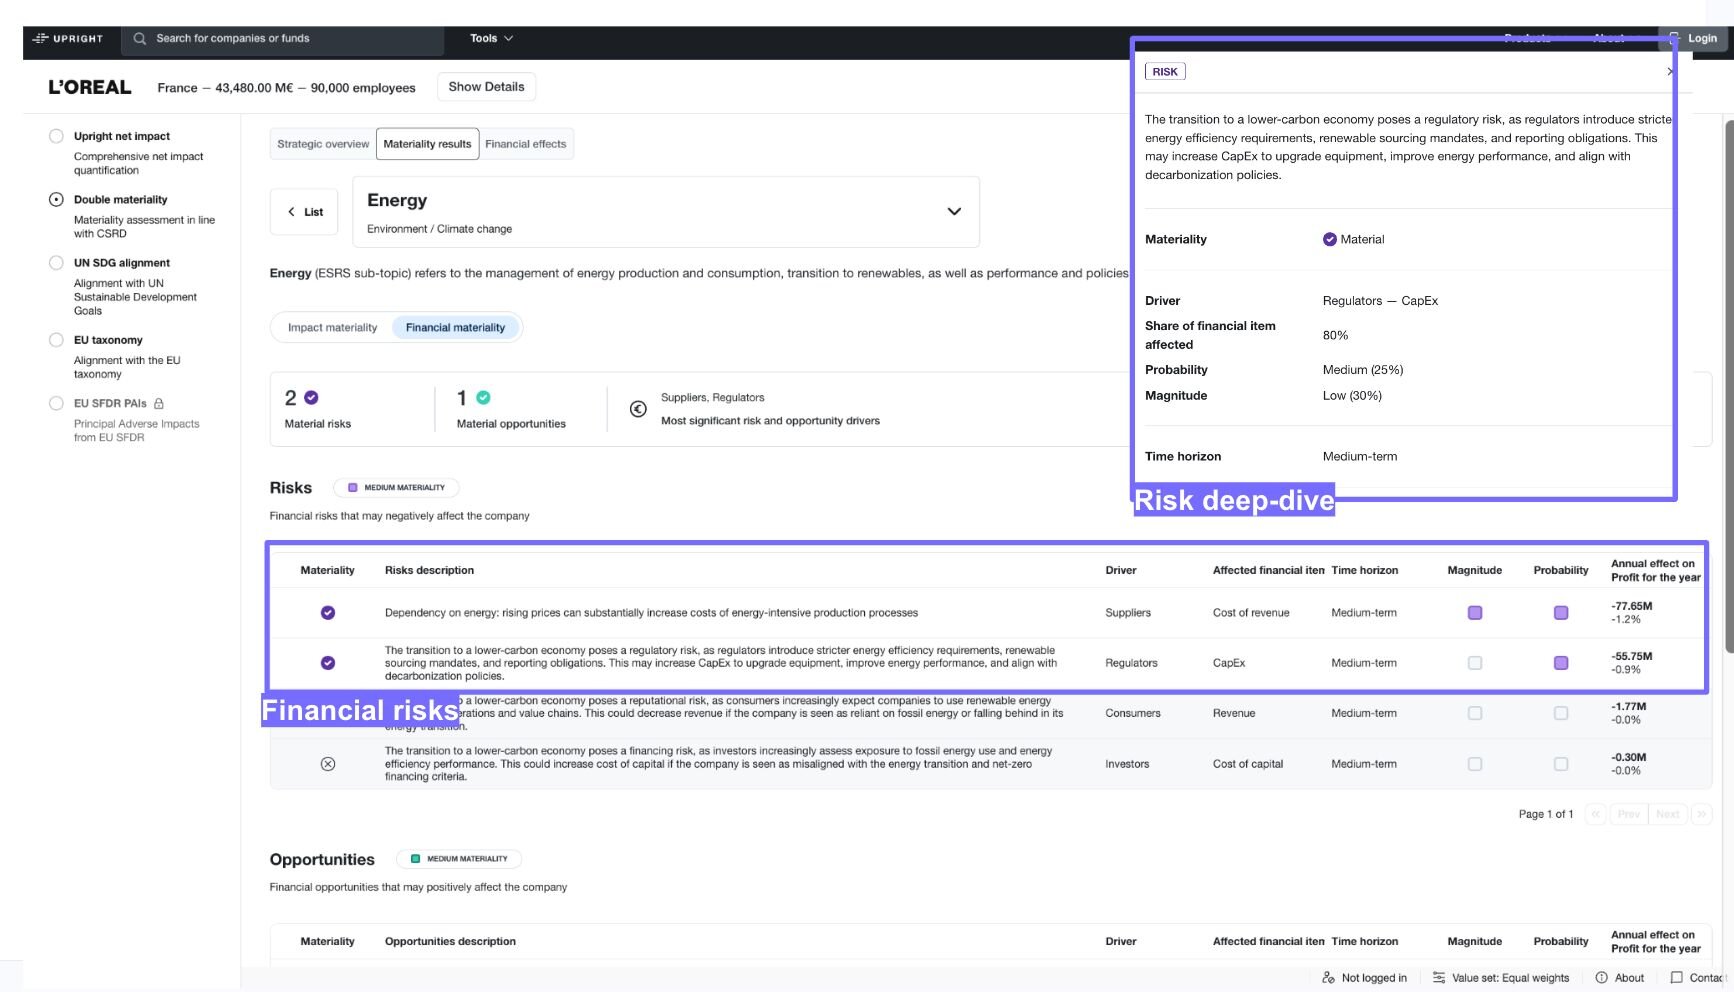
Deep-dive panel for energy-related transition risk for L'Oréal, showing regulatory driver, CapEx impact, medium-term horizon, and 25% probability
Step 4: Refine and stress-testThe final step is where the model becomes truly useful for internal decision-making.
Users can adjust key assumptions — for example, incorporating non-public information about mitigation actions already underway, or changing probability weightings based on internal insights. You can also align materiality thresholds directly with those used in your existing ERM framework, so sustainability risks and financial risks are assessed on exactly the same terms.
What do teams actually do with this?
Once sustainability risks are expressed in monetary terms, several things become possible that weren't before:
Prioritise with confidence. Instead of ranking sustainability topics by stakeholder salience or regulatory prominence, rank them by financial magnitude. The topics that matter most to your business become obvious — and defensible.
Calculate real ROI. Compare the cost of a mitigation programme against the financial risk it reduces. Demonstrate the payback period of a sustainable product line investment by projecting revenue growth.
Integrate into ERM. Present sustainability risks alongside operational and financial risks, using the same thresholds and language. No more separate sustainability risk register that finance doesn't read.
Support planning and scenario analysis. Stress-test your P&L and cash flow against different future sustainability scenarios — regulatory tightening, commodity price shocks, physical climate events.
Meet regulatory requirements. Satisfy financial materiality requirements under CSRD, ISSB, and California Climate Laws with science-based, audit-ready quantification.
Assess suppliers differently. Rather than scoring suppliers on abstract ESG ratings, quantify their actual financial exposure to transition and physical risks — and use that to inform procurement decisions.
See it in action
The best way to understand what this looks like in practice is to watch it. See this demo of the the four-step process applied to a real company:
If you'd like to explore what financial quantification could look like for your specific use case, our team is happy to run a personalised session — including sharing our full methodology documentation.

Upright Project
Share:
