Measuring impact
CoCoCo Bench: how consistently do LLMs quantify consequences in 2026?
How much a consequence matters to a frontier model still depends on what you compare it with. As models make more of our decisions, the consistency matters. We first measured this in April 2025 and are now releasing CoCoCo Bench v2, which refines the methodology, tests 20 current models, and will be updated as new ones are released.

William Nurmi
Upright
Published Nov 12, 2026
Introduction
Language models are doing more and more of our decisions on our behalf. There are at least three ways in which they decide for us, all becoming more prominent by the day. First, we were just consulting them with our small and big decisions. Second, they started acting autonomously on our behalf, making multiple little decisions for us as they work, without us ever even noticing. Thirdly and most recently, with the advent of decision models, we have started incorporating decisions in all parts of our business processes and software stacks: when to raise an alarm, who gets to speak to a human, which model should serve whom?
These decisions are judgements about consequences, about which outcome matters more and by how much. Those judgements are less stable than they look. Ask a leading model how much losing a customer would hurt your company, and the answer can change depending on whether it compares it with a week of downtime or a delayed product launch. When you think about it, a decision maker whose sense of scale shifts with the question is hard to trust. So far, the solution has mostly been to not think about it. As systems act more autonomously, and we delegate more and more of our lives to these models, consistent sense of the consequences is becoming imperative to trusting them.
A year ago we published an evaluation of how consistently large language models quantify consequences. Already back then frontier models knew a surprising amount about the impacts of products and services, but looking at their decisions more closely revealed that their quantitative judgements were locally plausible and globally inconsistent. Sizes did not survive transitivity checks and underweighted well-researched harms.
Today, as the stakes are getting higher, we've brushed up our methodology and publish it as a continuously updated CoCoCo Bench, the Consequence Comparison Consistency Bench. This post explains what the benchmark asks, what changed since 2025, and what we can learn from it.
What CoCoCo Bench measures
Imagine being asked whether the greenhouse gas emissions from chocolate production are a bigger deal than the joy it brings. Or if the joy is worth the impact on one’s health. Now extend that to thousands of such comparisons across hundreds of impacts, answered one at a time, in a way that stays logically consistent: if impact A is ten times B, and C is five times A, then C must be fifty times B — all without remembering or keeping track of your previous answer. Doing this well takes consistent counterfactual reasoning, causal attribution, and a balanced value system.

CoCoCo Bench asks each model 3,000 such questions across five products, pairing each of the 25 relevant impacts with the others. The answers are scored on how well they agree with each other. Each model answers with its estimated ratio of the impact sizes, and from all of a model’s answers for a product we fit the one set of impact sizes that best explains them. Each comparison then earns credit for how closely its stated ratio matches the ratio of those fitted sizes: full credit for an exact match, none at a gap of one standard deviation of the model’s own fitted ratios. The CoCoCo Score is the average credit over all 3,000 comparisons. A model scores 100 only when its answers agree with one underlying set of sizes; random answers score about 8.
(The full question wording, the scoring rule and a downloadable results file are on the CoCoCo Bench page.)
What changed since 2025
A graded score, on five products and relevant impacts, and a few other things...
- Relevant impacts, five products. The 2025 cross-model table used one product. Version 2 ranks models on five private products in food and beverage, medical, technology and finance sectors, and publishes the models’ answers to a second set of five (electric passenger cars, social media platforms, large language models, chocolate and student loans) so that anyone can check a model’s score. For each product, the 25 largest applicable impacts from Upright’s taxonomy were selected by frontier models before any contestant answered.
- All pairs, both ways. 600 questions per product, 3,000 per model, so each impact is compared with the 24 others and the fitted sizes are well determined.
- No opting out. In 2025 a model could answer that an impact does not apply, and those pairs were dropped. Now the impacts are selected as relevant, so answers must be positive numbers, and anything unanswered counts as zero credit.
- A graded score. The 2025 metric, CoCoCo %, counted the share of comparisons within half a standard deviation, and had saturated: the leaders were at 94%. In the new CoCoCo Score, credit falls off continuously with the size of the error, so the task is harder. The scores are therefore not directly comparable with the 2025 percentages.
- Sufficient reasoning. We've tested the effect of reasoning and found that extensive reasoning does not pay off in consistency, so each model runs at the lowest reasoning setting its provider enables.
Results
The new Fable 5.2 is in a league of its own with a CoCoCo Score of 81.0, 5.6 points ahead of the next five models, which score within 1.4 points of each other.
- Score
- 81.0
- Rank
- 1st
- Public set
- 82.4
- Answered
- 100%
- USD per 1,000
- 11.1
- Score
- 75.4
- Rank
- 2nd, shared by 5
- Public set
- 76.4
- Answered
- 100%
- USD per 1,000
- 9.5
- Score
- 75.3
- Rank
- 2nd, shared by 5
- Public set
- 74.6
- Answered
- 100%
- USD per 1,000
- 9.6
- Score
- 75.2
- Rank
- 2nd, shared by 5
- Public set
- 79.7
- Answered
- 100%
- USD per 1,000
- 18.3
- Score
- 74.1
- Rank
- 2nd, shared by 5
- Public set
- 78.3
- Answered
- 100%
- USD per 1,000
- 3.6
- Score
- 74.0
- Rank
- 2nd, shared by 5
- Public set
- 76.5
- Answered
- 100%
- USD per 1,000
- 15.6
- Score
- 71.6
- Rank
- 3rd, shared by 3
- Public set
- 77.3
- Answered
- 100%
- USD per 1,000
- 1.9
- Score
- 69.7
- Rank
- 3rd, shared by 3
- Public set
- 73.8
- Answered
- 100%
- USD per 1,000
- 2.9
- Score
- 69.6
- Rank
- 3rd, shared by 3
- Public set
- 72.3
- Answered
- 100%
- USD per 1,000
- 3.2
- Score
- 65.5
- Rank
- 4th, shared by 3
- Public set
- 64.3
- Answered
- 100%
- USD per 1,000
- 0.35
- Score
- 65.4
- Rank
- 4th, shared by 3
- Public set
- 65.1
- Answered
- 100%
- USD per 1,000
- 11.5
- Score
- 63.0
- Rank
- 4th, shared by 3
- Public set
- 63.7
- Answered
- 100%
- USD per 1,000
- 0.39
- Score
- 62.4
- Rank
- 5th
- Public set
- 62.7
- Answered
- 100%
- USD per 1,000
- 6.6
- Score
- 58.4
- Rank
- 6th
- Public set
- 57.0
- Answered
- 100%
- USD per 1,000
- 0.80
- Score
- 54.0
- Rank
- 7th, shared by 4
- Public set
- 57.4
- Answered
- 99.7%
- USD per 1,000
- 17.9
- Score
- 51.8
- Rank
- 7th, shared by 4
- Public set
- 54.9
- Answered
- 100%
- USD per 1,000
- 3.9
- Score
- 51.6
- Rank
- 7th, shared by 4
- Public set
- 55.9
- Answered
- 99.9%
- USD per 1,000
- 0.47
- Score
- 51.2
- Rank
- 7th, shared by 4
- Public set
- 57.5
- Answered
- 100%
- USD per 1,000
- 2.3
- Score
- 46.0
- Rank
- 8th
- Public set
- 44.3
- Answered
- 97%
- USD per 1,000
- 0.29
- Score
- 39.8
- Rank
- 9th
- Public set
- 40.9
- Answered
- 100%
- USD per 1,000
- 0.41
No model comes near 100. Fable 5.2’s 81 corresponds to answering, on average, within a factor of about 1.3 of the value implied by its other answers. Below the leader, consistency comes cheaper: Gemini 3.7 Flash stands out on the Pareto frontier, landing within ten points of the leader at a sixth of its price. GPT-5.6 Luna and, surprisingly, Llama 4 Maverick score in the 60s for under a dollar per 1,000 questions. We suspect Maverick does well because consistency benefits more from the broad general knowledge of a MoE behemoth than from sharp reasoning.
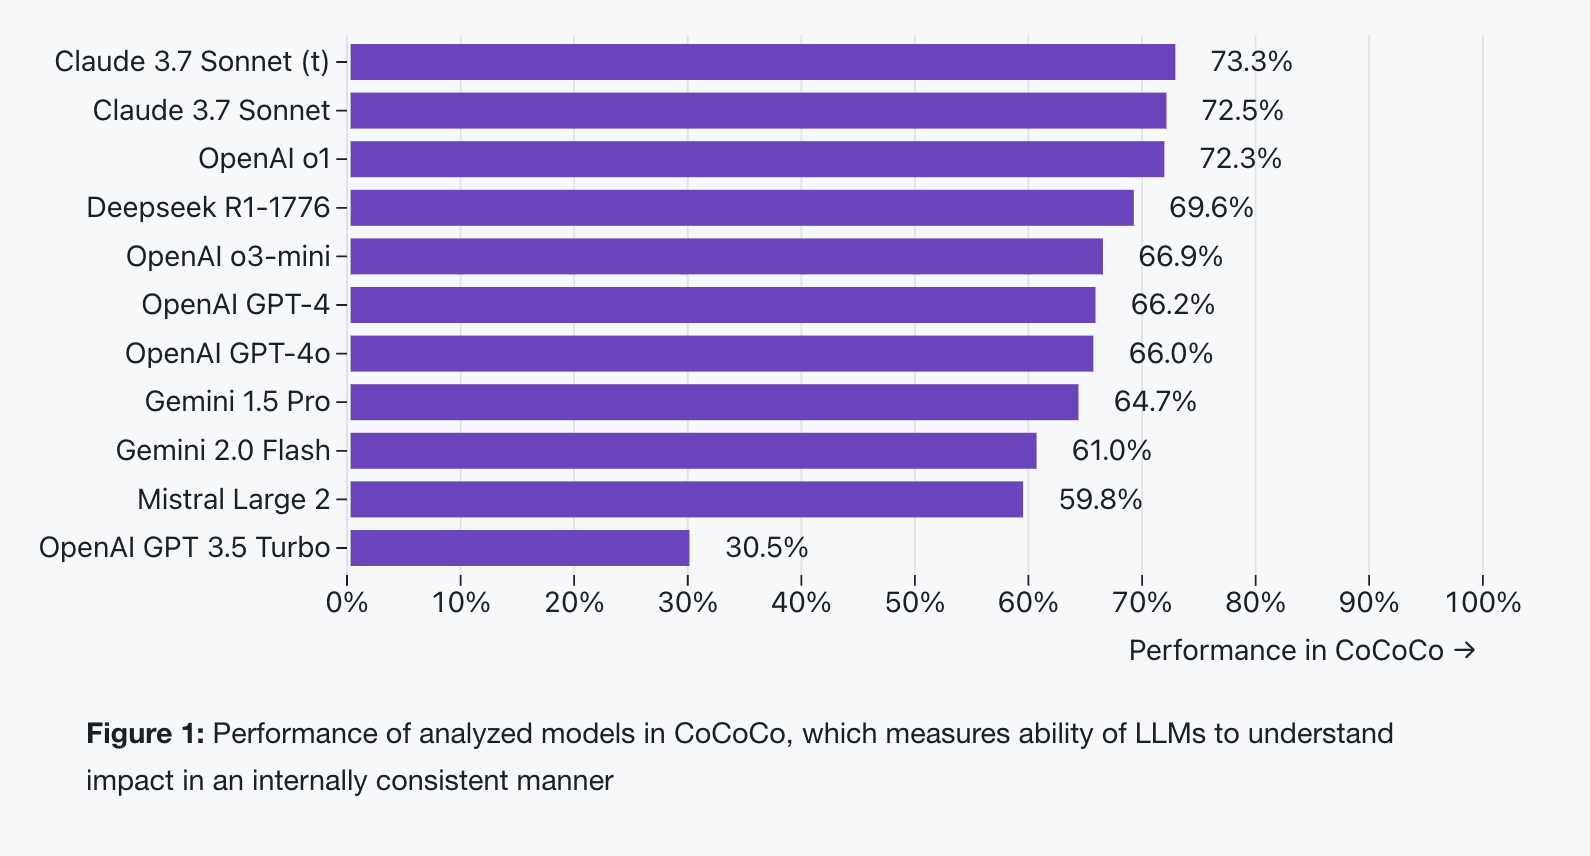
The frontier has moved since 2025. GPT-4o (2024) scores 51 against 81 for the current leader. GPT-3.5 Turbo (2023) scored 22 on the published products before OpenAI retired it. The reverse check agrees: on a 600-question subset of the 2025 questions, scored with the 2025 CoCoCo % metric, the best model of that edition reaches 76 % and GPT-6 Astra 93 %.
More reasoning does not seem to help with consistency. In our pilots, raising the reasoning effort moved scores by less than the resampling range, which is why the leaderboard runs each model at the lowest enabled setting. The one model we also ran with thinking off, Alibaba’s Qwen3.5 Plus, scored higher that way (57 against 54).
Generalist vs specialist decision models
Generalist language models have grown far more consistent, but they still contradict themselves. In a separate study, we asked GPT-6 Astra, Fable 5.1 and Opus 5.5 to quantify all impacts of products and companies. When asking the same question three times each, the size a model gave an impact category changed by a factor of two or more in about a quarter of cases, and by three or more in about one in twelve. We suspect consistency comes from a model’s architecture and what it has learned, rather than from how long it thinks.
Specialist models, like Upright’s Eevo-1, can of course do better. Eevo-1 scores 83.7 at $0.28 per 1,000 questions at its API price, 2.7 points above the best general-purpose model (a gap inside the tie band) at 1/40 of its price (show on the chart). It is trained for consistency on Upright’s impact-sizing data, and holds one size per impact so the size it gives an impact does not move when the comparison partner is swapped.
Limitations, data and citing
What the benchmark does not measure, getting your hands on the data, and citing.
Limitations
- Five products and 125 impacts is a relatively small sample. Redrawing them moves most scores by about five points either way, so gaps of a few points between neighbours are not meaningful.
- The benchmark measures consistency, not accuracy. A model can be consistent and still wrong about the world.
- Each comparison is a single question at the lowest enabled reasoning setting, without tools or web search. It tests the coherence of the model's judgement and knowledge, which influences but does not fully determine how reliable the model is when it can research.
Data and access
The leaderboard table gives each model’s share of questions answered, list price per 1,000 questions and release date, and the table can be downloaded as results.json. The results are released under the Creative Commons Attribution 4.0 licence: you may share and adapt them, including commercially, with credit to Upright.
The questions are not published, because a model could be trained on them: AI labs and researchers can request the public set’s questions and the code that asks them, and the private set goes only to independent evaluators under an agreement, not to model developers.
Notices
Upright has a U.S. patent pending on key techniques underlying this benchmark.
Citing
To reference this tech report, you may use the citation information below:
Nurmi, W., & Ojala, J. (2026). CoCoCo Bench: how consistently language models quantify consequences (Technical Report No. UPTR-202602). Upright Oy. https://www.uprightproject.com/blog/cococo
Want to know more?
If your work touches on AI decision making, alignment, or evaluation and you would like to discuss CoCoCo Bench, or have a model evaluated, write to hello@uprightproject.com. We are also hiring engineers who want to work on better impact data; see our jobs page.
November 12th, 2026
William Nurmi
Upright
Share: